
Having just updated the climate bet, which confirms the lack of recent warming (ie: the ‘pause’ or ‘hiatus’ as some call it), I thought next we should take a look at global energy emissions on the same time comparative basis.
For those who are not sure of the background, take a look at a few of my previous posts on ‘The Bet’ and you’ll soon catch on. We are comparing two decades; a past decade Jan 2001 to Dec 2010, and a current decade Jan 2011 to Dec 2020. Of course we are only part way through the current decade, so we’re not making a full comparison.
Here’s the (very unexciting … even boring) graph.
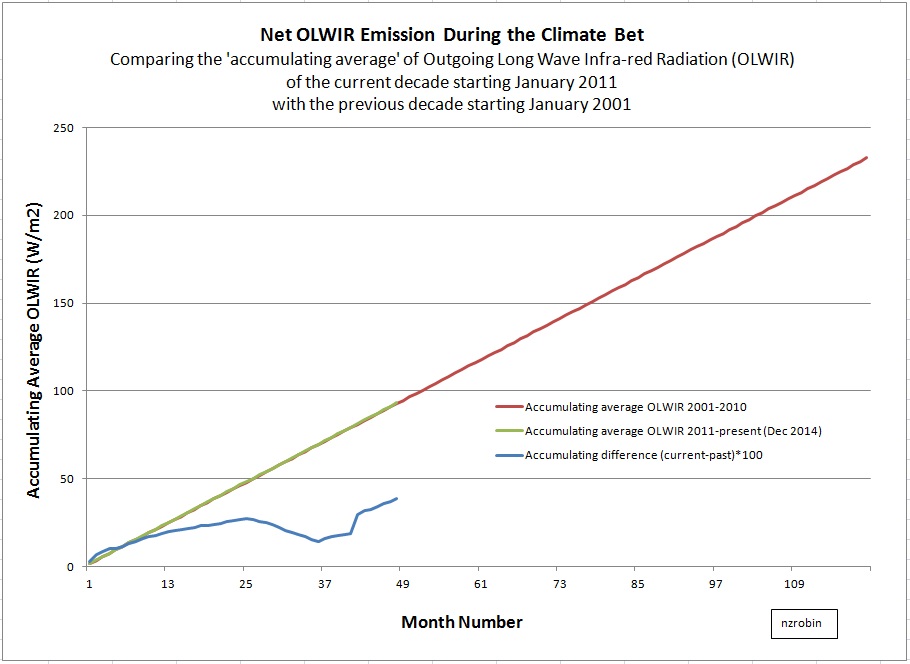
The data is monthly outgoing long wave infrared radiation (OLWIR) provided by the National Oceanographic and Atmospheric Administration (NOAA). I have totalled the energy emitted (OLWIR) in W/m2 units from each 2.5 by 2.5 degree latitude and longitude area to arrive at a global monthly average for each month. Then, in order to show emitting energy over the decade I have divided each monthly figure by 120 (the number of months in a decade) and produced an accumulating total.
The first four years of the comparison shows hardly any difference. The current decade (green line) sits right on top of the past decade (red line). The blue line zooms in on the difference, which is just the difference multiplied by 100. The heat is going into space in very nearly the same quantity as usual.
It is also worth noting (some would think worth highlighting) that the current decade shows slightly higher emissions, while temperature shows slight cooling. Higher outgoing energy, at the same time as a lower temperature, is exactly opposite to what the global warming models tell us will happen.
Also – all that talk of the missing heat hiding in the oceans. It’s just scary story. The missing energy is speeding away at 300,000,000 m/s, past Alpha-Centauri and beyond … and will never be seen again.
The spreadsheet workings are available for viewing here:
https://drive.google.com/folderview?id=0BwCJWmtRR6xeOFZSNzVrVW5rcVE&usp=sharing
The link to the source data from NOAA is here:
Pingback: NOAA Data Show Outgoing Long Wave Infrared Radiation Higher This Decade – As Planet Cools Slightly!
Robin
>”Also – all that talk of the missing heat hiding in the oceans. It’s just scary story”
It is worse than that Robin. I’ve been investigating IPCC ocean warming attribution (which is merely speculation – no science) and the claim by Tim Naish and James Remwick of the NZ Royal Society Ten by Ten series that:
“5 Ninety-three per cent of the heat ………….from humankind’s use of fossil fuels has gone into the ocean”
James Renwick, Tim Naish, Royal Society Ten by Ten series
http://www.nzherald.co.nz/nz/news/article.cfm?c_id=1&objectid=11669116
Naish and Renwick are very much at odds with IPCC information in their Technical Summary, specifically TS TFE.4 (see link to CCG thread below) i.e. not only is the IPCC attribution physically impossible by their own data and assessment (see link below) but Naish and Renwick’s claim does not conform to IPCC TS TFE.4.
There’s a huge problem in the IPCC’s Technical Summary in regard to both ocean warming attribution and OLR. They have to account for a massive excess of GHG-forced energy (astronomical number – see link below). For that they say the greater portion of the excess has simply gone to space as “radiation response” (i.e. as OLR, that amount of their theoretical GHG forcing is totally ineffective therefore). But they need anthro ocean warming attribution to close their energy budget and keep their theory alive. In other words, their total theoretical TOA forcing is 4 times actual energy imbalance at TOA (2.33 vs 0.6 W.m-2 in AR5) so they have to sink their excess energy SOMEWHERE.
Their range of OLR uncertainty is humungous (see link below), and as you say, “speeding away at 300,000,000 m/s”. Reason is that they only “infer” OLR instead of deferring to what they describe elsewhere in the Technical Summary as “highly precise” satellite OLR data that you are deferring to.
The CCG post and thread I’m referring to is this, starting at the first relevant comment:
‘Ethics breach by Renwick and Naish – shock Royal Society probe’
http://www.climateconversation.org.nz/2016/08/ethics-breach-by-renwick-and-naish-shock-royal-society-probe/comment-page-1/#comment-1509795
IPCC WG1 AR5 Technical Summary TFE.4 Figure 1 (a) and (b) is linked in that comment and reproduced here for convenience:
TS TFE.4-1 (a) (b)
https://www.ipcc.ch/report/graphics/images/Assessment%20Reports/AR5%20-%20WG1/Technical%20Summary/FigTS_TFE.4-1.jpg
If you wade through the thread you can see that I’ve taken the issue further i.e. it is more than just internal unethical conduct by Naish and Renwick, it is (on the face of it) unlawful activity by the Royal Society.
[last paragraph deleted]
‘Complaint Accepted Against Two Victoria University Professors for Breach of Royal Society’s Code of Ethics’
Press Release: New Zealand Climate Science Coalition
Monday, 29 August 2016, 2:59 pm
The Royal Society of New Zealand has confirmed the commencement in accordance with its rules of a process to consider a complaint by several of its members that two Victoria University academics, Professors James Renwick and Tim Naish, have breached the society’s Code of Ethics in their public programme of lectures throughout the country entitled “Ten Things You Didn’t Know About Climate Change”.
[…]
Link here to:
Complaint and Professor Kelly’s paper: http://nzclimatescience.net/index.php?option=com_content&task=view&id=1370&Itemid=1
Complaint
http://nzclimatescience.net/images/PDFs/rsnz%20ethics%20complaint.final.pdf
Scoop Press Release
http://www.scoop.co.nz/stories/SC1608/S00080/complaint-against-two-victoria-university-professors.htm
Complaint:
Those examples don’t get to the crux of the IPCC’s problem of accounting for their massive excess of theoretical GHG-forced energy. We are talking astronomical numbers (see below). This is even before model implementation of theory. Examples 3 and 4 come closest to the critical issue but those 2 examples are in respect to models. TS TFE.4-1 has nothing to do with models.
Theoretical GHG-forced energy just from 1970 to 2011 is 1200 ZetaJoules at TOA (see TFE.4 Figure 1 (a) upthread and in Technical Summary below). Probably now in the order of 2000 ZetaJoules 1750 – 2016.
Thar’s 2,000,000,000,000,000,000,000,000 Joules 1750 – 2016 roughly.
And 700,000,000,000,000,000,000,000 Joules of IPCC uncertainty in OLR just in the short period 1970 – 2011.
This massive uncertainty is hidden in plain sight, in the Technical Summary at least. It has been staring everyone in the face but no-one realizes what a monumental issue this is.
IPCC AR5 WG1 Technical Summary
https://www.ipcc.ch/pdf/assessment-report/ar5/wg1/drafts/fgd/WGIAR5_WGI-12Doc2b_FinalDraft_TechnicalSummary.pdf
The uncertainty in TS TFE.4-1 closure accounting is by far the greatest uncertainty I can find in the AR5 assessment. I challenge anyone to find greater.
I can’t think of greater IPCC uncertainty than this, of even if greater uncertainty is even possible.