
In a comment Stuart asked “Any chance of a post on synthetic inertia from PV/wind turbines/HVDC links, and why it does or doesn’t help? I keep reading that curtailing the output from the maximum to give some ‘headroom’ allows these things to react similarly and replace rotating generators with electronics, helping stability.”
Well Stuart, great comment – here goes. There are two main themes you’ve included in your comment, curtailment and synthetic inertia.
In order to tackle this I developed a power system stability model. It’s an Excel spreadsheet using a stepwise (0.1 second) time domain development of the swing equation df/dt = P/M and some generation and load response mechanisms/characteristics.
A copy of the Excel worksheet is available here. Please do download a copy.
Before we look at the questions I’d like to explain how the model works, the equations used and some of the limitations. It’ll take a few posts and a degree of patience, so if you’re interested please follow along. And feel free to ask a question.
The sheet is not locked in any way so be careful how and where you type. However, if you do happen to mess it up, you can always come back and download a fresh copy.
Here’s a quick overview of the sheet. Input variables are shaded yellow (which should be the only cells you need to modify).
The blocks of input data requirements are; the pre event conditions, the disturbing event at time T=0, the governor characteristics, the battery based response, the under frequency load shedding, the rate of change load shedding, and the inertia based fast frequency response. Each one of these will be discussed in more detail in later posts.
The calculation table from Row 27 down steps through the simulation one model increment at a time. Each line calculates the power imbalance, which acts upon system inertia to produce a frequency change. The resulting frequency and rate of change of frequency is applied to the system control elements to produce the power conditions for the next increment. These equations too will be described in future posts.
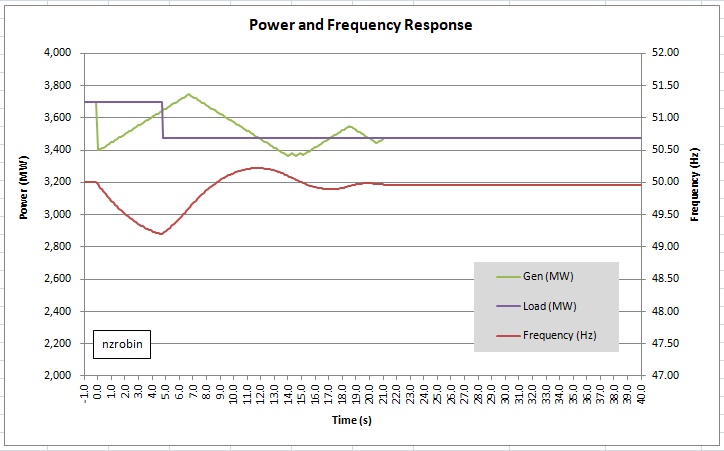
The graph below is an example of the output from the model. It shows net generation in green, net load in purple, and system frequency in red. Here’s what happens in this example:
The system is running stably with 3500 MW of synchronous generation and 200 MW of asynchronous generation, net generation 3700 MW. At time T=0 the system loses 300 MW of synchronous generation, net generation drops to 3400 MW, and the frequency starts to fall because the net load is still 3700 MW.
The synchronous governors sense the frequency dropping and begin increasing output. The rate of frequency decline is reducing as generation increases. At the point when the frequency hits 49.2 Hz (4.8 seconds) the first block of under frequency shedding occurs. The load drops by 222 MW to 3478 MW. At this time the generation is at 3647 MW and so the frequency commences recovery.
The governor continues to sense both frequency and rate of change of frequency and adjusts output using droop, differential and machine limits to restore power balance at a slightly lower frequency after around 20 seconds.
That’s an interesting model. I’ve downloaded it and had a little play. You may want to try setting parameters that might be relevant in Australia, given the big debate over Musk’s new battery there.
http://reneweconomy.com.au/tesla-big-battery-outsmarts-lumbering-coal-units-after-loy-yang-trips-70003/
Incidentally – don’t give up on trying to comment at Euan Mearns’ site. The software is a little quirky, and just because you’re accused of submitting a duplicate comment it isn’t the case. Almost all comments go into moderation (including those from Euan himself!) and it can take some hours before either he (in Scotland) or Roger Andrews (in Mexico) releases them. There are some quality contributors there from all sides of debate.
Thanks for commenting. I intend to continue describing the model for a few more posts yet, and then I’ll have a go at showing the effect of various responses while changing the level of system inertia and generator types. The outcome should be a better understanding of the effects and interrelationships, but the model has not got anything like enough detail to model the South Australia grid.
My goodness, Anthony, I didn’t realise I would put you to such trouble! Thanks. Something to think on over Christmas, but if I’ve anything intelligent to add it will be after the family invasion. Have a good one.
Stuart
Thanks Stuart. It is indeed quite a bit of work but it is something that I’ve wanted to do for a while. It is quite a concern that the grid is being de-stabilised due to ignorance. I live in the hope that my efforts will help bring some understanding. I too have a family invasion over a few weeks over Christmas. And you have a good one too.