
The previous article described the relationship between power imbalance and rate of frequency change for the first few seconds after a disturbance in power balance. Important as those few seconds are, the few seconds of energy being provided by the spinning angular momentum of the synchronous machines, if something isn’t done to correct the power imbalance within those few seconds, collapse will certainly follow in only a few more seconds. Feedback control is the key to this response. The machine governor is the all important device providing the control … and if there is insufficient governor response the backstop is load shedding triggered by under frequency relays.
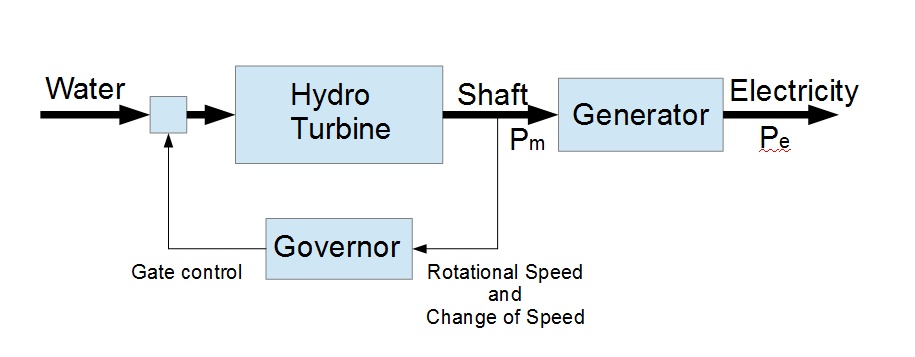
The diagram below shows how a governor fits in the system as a feedback controller. The governor’s purpose is to sense the shaft rotational speed, and the rate of speed increase /decrease, and to adjust machine input via a gate control.
Remember that shaft rotational speed w is directly aligned with frequency, and that frequency has to be kept within about +/- 0.5 Hz of nominal, and that power imbalance, angular momentum and rate of frequency change is described by Pm – Pe = M * dw/dt.
Starting with an initial condition where the machine running a constant speed w, Pm = Pe and dw/dt =0. When more electrical load Pe is taken from the generator (Pe>Pm), rotational energy will be extracted from the machine and it will slow (dw/dt<0). Of course the opposite would happen if less electrical load was taken from the generator.
The governor’s job is to continuously monitor the rotational speed w of the shaft and the rate of change of shaft speed dw/dt and to control the gate(s) to the prime mover. In the example below, a hydro turbine, the control applied is to adjust the flow of water into the turbine, and increasing or reducing the the mechanical power Pm compensate for the increase or reduction in electrical load, ie: to approach equilibrium.
It should be pointed out that while the control systems aim for equilibrium, true equilibrium is never actually achieved. Disturbances are always happening and they have to compensated for continuously, every second of every minute of every hour, 24 hours a day, 365 days a year, year after year.
The discussion has been for a single synchronous generator, whereas of course the grid has hundreds of generators. In order for each governor controlled generator to respond fairly and proportionately to a network power imbalance, governor control is implemented with what is called a ‘droop characteristic’. Without a droop characteristic, governor controlled generators would fight each other each trying to control the frequency to its own setting. A droop characteristic provides a controlled increase in generator output, in inverse proportion to a small drop in frequency. Refer to the graph below.
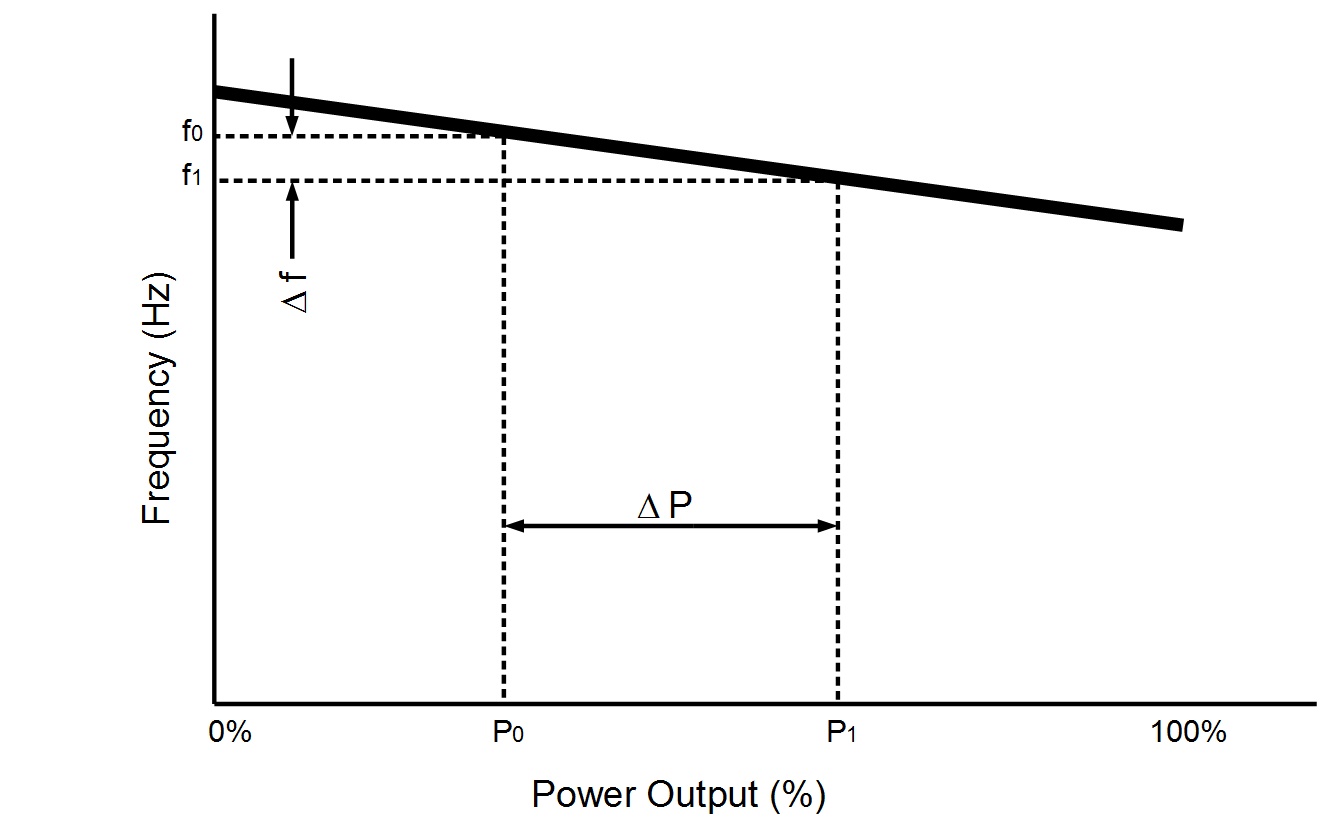
The governor senses system frequency and it controls it’s generator’s prime mover to increase the generator’s output according to the droop characteristic. The droop slope is typically referred to in percentage terms. It is typically about 4%. This equates to 2 Hz drop in a 50Hz system for a 0% to 100% change in generator output.
In New Zealand the normal operational frequency band is 49.8 to 50.2 Hz. An under frequency event is an event where the frequency drops to 49.25 Hz. It is the generators controlled by governors with a droop characteristic that pick up the load increase and thereby maintain stability. If it happens that the event is large and the governor response is insufficient to arrest the falling frequency, under frequency load shedding relays turn off load.
Here is a record of an under frequency event earlier this month, where a power station tripped.
The generator tripped at point A which started the frequency drop. The rate of drop dw/dt is determined by size of the power imbalance divided by the synchronous angular momentum (Pm – Pe)/M. In only 6 seconds the frequency drop was arrested at point B by other governor controlled generators and under frequency load shedding, and in about 6 further seconds additional power is generated, once again under the control of governors, and the frequency was restored to normal at point C. The whole event lasting merely 12 seconds.
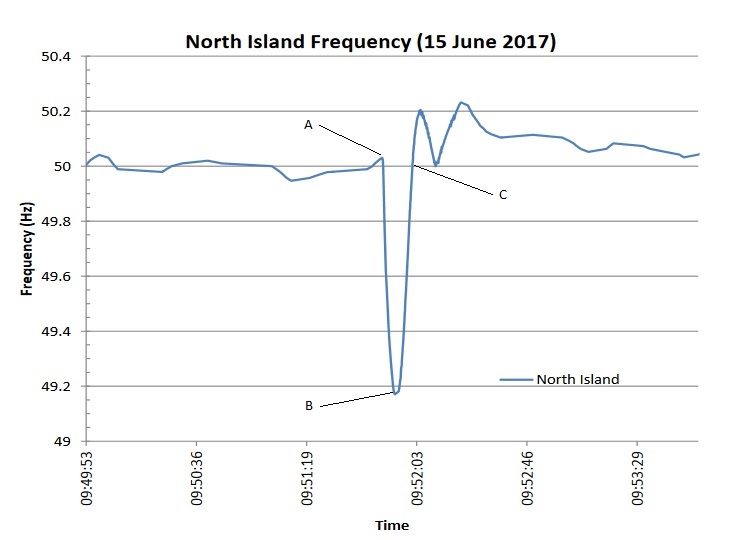
So why would we care about a mere 12 second dip in frequency of less than 1 Hz. The reason is that without governor action and under frequency load shedding, a mere 12 second dip would instead be a complete power blackout of the North Island of New Zealand.
The next article will look more closely at this event.
[Article updated 9 Jul 17 following comments from chrism56. Thanks Chris]
Index
- Introduction – Electric Power System Stability
- Electric current is generated ‘on demand’. There is no stored electric current in the grid
- Energy balance, imbalance and a definition of grid stability
- Generator types; synchronous versus asynchronous. What goes on inside the machines?
- Frequency stability and energy balance. A description of the interaction between frequency and grid energy flow
- Control of the prime mover, governors, how it is done and why it matters
- Analysis of an under frequency event
Pingback: Electric Power System Stability | Kiwi Thinker
My understanding is that intermittent sources such as solar and wind are major sources of instability but can play little or no part in responding to (as opposed to causing) frequency variations, and that this is a major factor in, for example, blackouts in the South Australian system. Is this correct?
Yes, that’s right. I hope the posts I have done help to explain why.
Thank you for these. Good explanation of how generation follows demand and why synchronous inertia is so important.
Any chance of a post on synthetic inertia from PV/wind turbines/HVDC links, and why it does or doesn’t help? I keep reading that curtailing the output from the maximum to give some ‘headroom’ allows these things to react similarly and replace rotating generators with electronics, helping stability.
Thanks Stuart, Yes I do intend to carry on with a few more articles covering these points. The next one is going to be an analysis of a frequency drop, rate of decline, depth, etc. It’ll be a short summary of the key points.
Then I’ll have a go at synthetic options.
Anthony
I had a look at the data for the 15th. TCC was doing 310MW when it fell off. Total load for the country was 5552MW, E3P was 400MW, SPP on 215MW, the Rankines on 400MW. As usual, wind providing next to nothing. The Waikato hydros didn’t pick up load nor did any of the thermals straight away. The DC went from southwards to northwards flow. They must have managed the rest by load shedding. So in this case, probably no help from governor droop.
There was another dip on the 11th when TCC fell off the first time. 2:22am. TCC was 342MW of the 3386MW. Frequency dropped to 49.09. DC was doing 200MW south. No obvious spinning reserve pick up. E3P picked up 30MW after 10 minutes, Maretai 50MW after 15 minutes and a peaker 100MW after 40 minutes. The load was still dropping which helped.
The other one of interest was on the 17th at 10:42. Frequency dipped to 49.2 and then rose to 50.5Hz. 4300MW on the grid. Caused by the three lines out of Maraetai tripping.
Thanks for all those details Chris. Very useful background material.
By the way, I am glad that you came and commented here. I had tried a few times to place some more comments at Euan Mearns’ site but kept on getting a duplicate comment dialogue that stopped me making any comments. Quite annoying it was.
After sleeping on this … Whether or not you can observe governor action in the data, will depend on the time resolution of the data. What is the time resolution of the data you’re looking at Chris?
The data in historian is condensed so it only shows when it has gone outside the filter bands put on it. Because it isn’t on our server, I don’t know what the bands are but I would surmise they look about 1-2%. Where there is sawtooth data, the time stamps show they can be as close as 1 or 2 seconds apart.
I also pulled in the Genesis hydros’ data. It looks like Tokaanu and Tekapo B have been sharing frequency keeping or short period generation duties. That makes what happened during the trips hard to identify. However, during the trip on the 11th, there was a short term spike up on both Tokaanu and Rangipo of about 50MW total. For the other two, I’m not so sure as to what was happening. The total generation sum shows a big drop, indicating that they reduced load.
I’m not sure of the actual settings, but the swing may have been big enough to activate all the ripple control relays. I think it has got an automatic as well as a manual setting. At the time of the trips, this could have shed 2-400MW if the older figures are still relevant.
If I get a chance this week, I will do graphs printed out of the events comparing TCC loss to grid loss and a few other parameters so I can study them more at my leisure.
I had a look at the data today in downtime. Unfortunately, the other stations’ generation data seems to be at 2 or 3 minute intervals. However, I can confirm that the total generation on the grid dropped by over 200MW for all three incidents and stayed down for at least ten minutes – long after the grid frequency was restored. That confirms to my mind that it was mainly managed by sheddable load.
Thanks Chris, that’s very interesting, and much appreciate your input. I’ll continue to look into the sheddable load position. If generation was down 200 MW for 10 minutes implies sheddable load must have been about the same and working quite well.
At all three times the trips occurred, the load was dropping – maybe 3- 500MWh per hour, guessing on the slope. That means the SO may have decided not to bring on short run generation to cover the loss. I don’t have easy access to historical spot price information. That could show if it was a price related decision to keep stations like Whirinaki off.
I don’t know whether you picked up this link
https://www.caiso.com/Documents/StrawProposal_FrequencyResponse.pdf
The lack of inertia is recognized, just no-one is listening.
That’s a good article Chris,
It certainly shows the issue is quite well understood by some.
Anthony
Here are the graphs.
https://www.dropbox.com/s/62ql1nrfh7i2s26/generation%20trip%20graphs.pdf?dl=0
For the Maraetai trip on 17th, (I got my 5:03 comment date wrong) it looks like they did have some machines on reserve – tailrace depression of a unit at Tokaanu and Ranipo were two I could identify. At that time of night, ripple control may have not been available.
Thanks.
From the graphs it looks to me that the governors start to increase output as the frequency drops, but then sheddable load is dropped, and the shed load is more than needed which introduces an over supply, and then the governors back off the generation to compensate.
The new ER regime (superseding AUFLS) is proposing more steps which should bring a better response. There are also thoughts of reducing droop to 2%, which will demand a quicker machine response. If it works and the machines can cope it should mean less shedding. I can’t help thinking though, that the main drive behind all this is to accommodate those new forms of generation that do not provide inertia or governor response.
Remember the timing on those graphs is wrong as I explained earlier. Only the frequency I have any confidence in. I don’t know what caused the overshoot on the 17th. No obvious 100MW pick up and the thermals were pretty tapped out.
Droop of 2% would be very bad. Even 4% causes plant to ramp up and down a lot. For hydros, that means a lot of running in the dirty water regime. That will ramp up maintenance costs a lot. The old governors on the Rankines at NPPS and Huntly used to have two settings from memory. 4% when on frequency control, and 25% when not.
Fortunately at present, the grid is pretty stable even though it is high demand. That is because there is no wind on.;-) As a result, spot prices are high and Meridian is taking a bath
Pingback: 7. Analysis of an under frequency event | Kiwi Thinker