
Let’s take a closer look at the under frequency event that occurred at 9.51am on Thursday June 15th 2017, in the North Island of New Zealand. This is quite a long post with quite a bit of technical detail.
The event was caused by the loss of generation at a gas fired power station in Stratford, Taranaki. Chris (chrism56) advised in comments on the previous post that it was the TCC (Taranaki Combined Cycle) power station that tripped, and that it was generating 310 MW just before it tripped. He checked some other generator outputs at that time and as he didn’t observe any significant droop pick up on the ones he looked at he deduced automatic under frequency shedding most likely operated. Good work Chris, turns out you were right.
There are a number of industrial plants contracted to immediately disconnect selected loads if the frequency falls to 49.2 Hz.
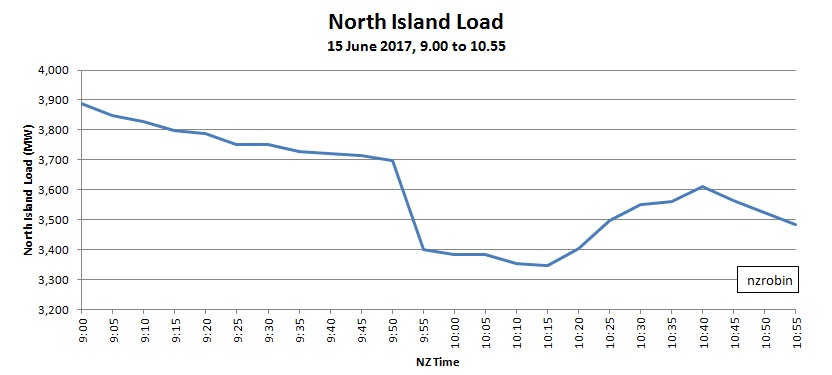
The graph below which is based on 5 minute load data from NZ’s System Operator confirms that load shedding occurred. The North Island load can be seen to drop 300 MW, from 3700 MW at 9.50 to 3400 MW at 9.55. The load restoration phase can also be observed from this graph. From 10.15 through 10.40 the shed load is restored in several steps.
The high resolution data that we’ll be looking at more closely was recorded by a meter with power quality and transient disturbance recording capability. It is situated in Masterton, Wairarapa, about 300 km south of the power station that tripped. The meter is triggered to capture frequency excursions below 49.2 Hz. The graph below shows the captured excursion on June 15th. The graph covers a total period of only one minute. It shows the frequency and Masterton substation’s load. I have highlighted and numbered several parts of the frequency curve to help with the discussion.
The analysis makes use of the equation P = M * df/dt, which is very similar to the equation developed in an earlier post. Here P is the grid net power imbalance in MW, M is the grid angular momentum in MWs/Hz, and df/dt is the rate of change of frequency in Hz/s.
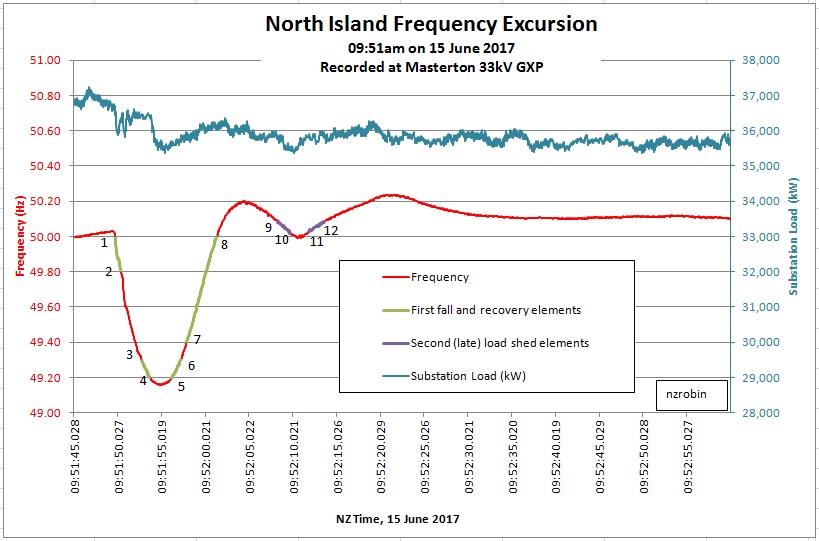
The first element we’ll look at is element 1 to 2. The grid has just lost 310 MW generation and the frequency is falling. No governors nor load shedding will have responded yet. The frequency falls 0.192 Hz in 0.651 seconds giving a fall rate df/dt of -0.295 Hz/s. From this df/dt result and knowing the lost generation is 310 MW we can derive the system angular momentum M as 1,052 MWs/Hz from -310 = M * -0.295.
It is interesting (and chilling) to calculate how long it would take for blackout to occur if no corrective action is taken to restore system frequency and power balance. 47 Hz is the point where cascade tripping is expected. Most generators cannot operate safely below 47 Hz, and under frequency protection relays disconnect generators to protect them from damage. This sets 47 Hz as the point at which cascade outage and complete grid blackout is likely. A falling frequency of -0.295 Hz/s would only take 10.2 seconds to drop from 50 to 47 Hz. That’s not very long and obviously automated systems are required to arrest the decline. The two common automatic systems that have been in place for decades are governor controlled generators and various levels of load shedding.
The next two elements we’ll look at are 3 to 4 and 5 to 6. From 3 to 4 the df/dt fall rate is -0.108 Hz/s. Using this df/dt and M for the system derived above,1,052 MWs/Hz, the imbalance is now a deficit of 114 MW. From 5 to 6 the frequency in increasing and df/dt is 0.095Hz/s. Using this df/dt and M as before, the imbalance is now a surplus 100 MW. The fall arrest between 4 and 5 has been due to automatic load shedding. New Zealand has a number of customers contracted to disconnect load at 49.2 Hz. From these figures we can estimate a net shed load of 214 MW (114 MW + 100 MW). The sudden drop in Masterton substation’s load from about 36.4 MW to 35.6 MW occurs as the frequency passes down through 49.2 Hz, (point 4 in the graph). It indicates that about 0.8 MW of the 214 MW was from Masterton substation’s load.
From 7 to 8 the frequency is increasing with df/dt of 0.111 Hz/s and the system has a surplus of 117 MW of generation. At point 8 the system reached 50 Hz again, but the system then over shoots a little and governor action works to reduce generation to control the overshoot between 8 and 9.
Another interesting event takes place between 10 and 11. It seems there is another (too late to be useful) load shed event. From 9 to 10 df/dt is -.039 Hz/s and a deficit of 41 MW. From 11 to 12 df/dt is 0.031 Hz/s and a surplus of 33 MW. This indicates a further 74 MW is shed in the period 10 to 11. It becomes necessary that the governors again sense the increasing frequency and pull it back after it moves up through 50.2 Hz.
This analysis shows how system inertia, under frequency load shedding and governor action work together to maintain system stability.
The analysis derived a total of 288 MW shed load (214 MW + 74 MW). As this was based on a differential analysis of system frequency it would not be an exact analysis. However, the result of 288 MW is close to the 300 MW drop shown on the North Island Load graph shown at the start of this post.
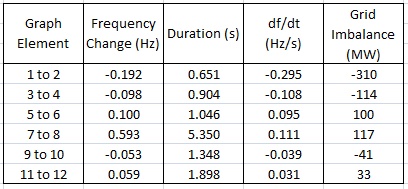
The table below provides a summary of the calculated results for the selected graph elements.
The data and graph may be found in a spreadsheet here:
The key points:
-
The system needs to be able to maintain stability second by second, every minute, every hour, every day, year after year. Yet when a major disturbance happens, the time available to respond is only a few seconds.
-
This highlights the essential role of system inertia in providing this precious few seconds. System inertia defines the relationship between power imbalance and frequency fall rate. The less inertia the faster the collapse and the less time we have to respond. Nearly all system inertia is provided by synchronous generators.
-
Control of the input power to the generators by governor action is essential to control frequency and power balance, bringing correction to maintain stability. This requires control of prime mover, typically this is only hydro and thermal stations.
-
When the fall rate is too fast for governor response, automatic load shedding can provide a lump of very helpful correction, which the governors later tidy up by fine tuning the response.
Index
- Introduction – Electric Power System Stability
- Electric current is generated ‘on demand’. There is no stored electric current in the grid
- Energy balance, imbalance and a definition of grid stability
- Generator types; synchronous versus asynchronous. What goes on inside the machines?
- Frequency stability and energy balance. A description of the interaction between frequency and grid energy flow
- Control of the prime mover, governors, how it is done and why it matters
- Analysis of an under frequency event
Anthony – thanks for the detailed analysis. My interest is more in the day to day maintenance so it is good to see someone go back and do the hard yards.
The 47Hz needs qualifying – it is instantaneous trip then. However, at higher frequencies, most thermal plant has time weighted trips. this means a pronounced long duration underfrequency event (the 4-5 step), then those thermal plants could trip off. This would cause the cascade.
The bounce you note (8-9-10) could have occurred because some machines have just a short term response. For example, suddenly opening the GVs on the Huntly machines will give a similar result as the extra generation will suck the steam pressure down until the effect of the burners ramping up comes through. I believe the SO has two different tables detailing short and long term ramp rates.
It has been interesting to see the system over the peaks on the cold days Wednesday and Thursday. All the synchronous power stations in the NI were flat out, including Whirinaki on diesel. The wind turbines were a lot better than usual, being on half load. There was just enough surplus generation to push power south, typically 100MW. The SO must have been on the edge of their seats. A single trip of a big unit (TCC or E3P) and it would have been very sticky.
Pingback: Electric Power System Stability | Kiwi Thinker
I don’t know whether it is still the case, but the NI used to be 47Hz and SI 45 Hz because it was all hydros there. With the two islands effectively being run as one grid, I wonder if this still applies.
There was rumoured to be a very large frequency excursion back in the 70s, that islanded Southland. Blew a whole lot of TVs that needed replacement.
The automatic under frequency load shedding (AUFLS) system is being superseded by a new system which is named
emergencyextended reserves (ER). In the NI the present system has two 16% tiers of load shedding based on frequency. The new system has four smaller tiers which should give better resolution (but still totaling 32%). Three are based on frequency and one based on rate of change of frequency. The two island are effectively independent of each other being connected by DC links. However I heard a presentation at the 2016 EEA Conference that Transpower have introduced (or maybe plan to trial) a limited DC control so that it becomes possible for the islands to support each other.And yes, as I understand it, the NI and SI do have different lowest operational frequencies, and I think that will have to continue for the reason you mention. While Transpower are controlling the DC link to transfer power from one island to the other to help compensate for an excursion, there is no AC tie so the frequencies are still independent of each other.
If you still have access to NI grid frequency data, look at the 13th August between about 1100 and 1330. System seems to have done about 7 drop loads, each around 50MW. It seems to have been looking at grid fast response as there was overfrequencies as part of the event. I haven’t worked out which machines they were doing it on. It may have been a number of them, but my data is too coarse to pick up that detail, especially after the condensation for storage.
I checked the meter logs and nothing was recorded through that time. The meters are triggered to record if the frequency goes below 49.2 Hz. The most recent event recorded was on 15 June where 310 MW drop took the frequency down to 49.17 Hz. If, as you say, their tests were dropping about 50 MW, the rate of fall will have been about 1/6th of than on the 15th, and they would have arrested the fall before the 49.2 Hz trigger point.
You are correct in that the frequency did not drop that low. About 49.6 was the lowest from memory. There was not a significant long term drop in total generation at the same time, indicating the tests were to look at governor response, rather than demand response.
Pingback: 2. Electric current is generated ‘on demand’. There is no stored electric current in the grid. | Kiwi Thinker
Pingback: 3. Energy balance, imbalance and a definition of grid stability | Kiwi Thinker
Pingback: 4. Generator types; synchronous versus asynchronous. What goes on inside the machines? | Kiwi Thinker
Pingback: 5. Frequency stability and energy balance. A description of the interaction between frequency and grid energy flow. | Kiwi Thinker
Pingback: 6. Control of the prime mover, governors, how it is done and why it matters | Kiwi Thinker
Looks like Ireland had a different type of frequency problem when there was a high level of wind generation
http://irishenergyblog.blogspot.co.nz/2017/12/technical-problems-with-high-levels-of.html
It would be interesting to know why they took so long to address the frequency decline